How to use the inFlow Dashboard
The inFlow Dashboard is a fantastic tool that provides quick, clear information on your organization’s inventory and orders. In this article, we’ll walk you through the details to help you make the most of your dashboard.
Web
Dashboard overview
Location filter
The Dashboard shows information based on the location selected at the top-left corner.
The location will default to inFlow’s default location. Each team member can change the location to their needs, and it will remain for each user profile.
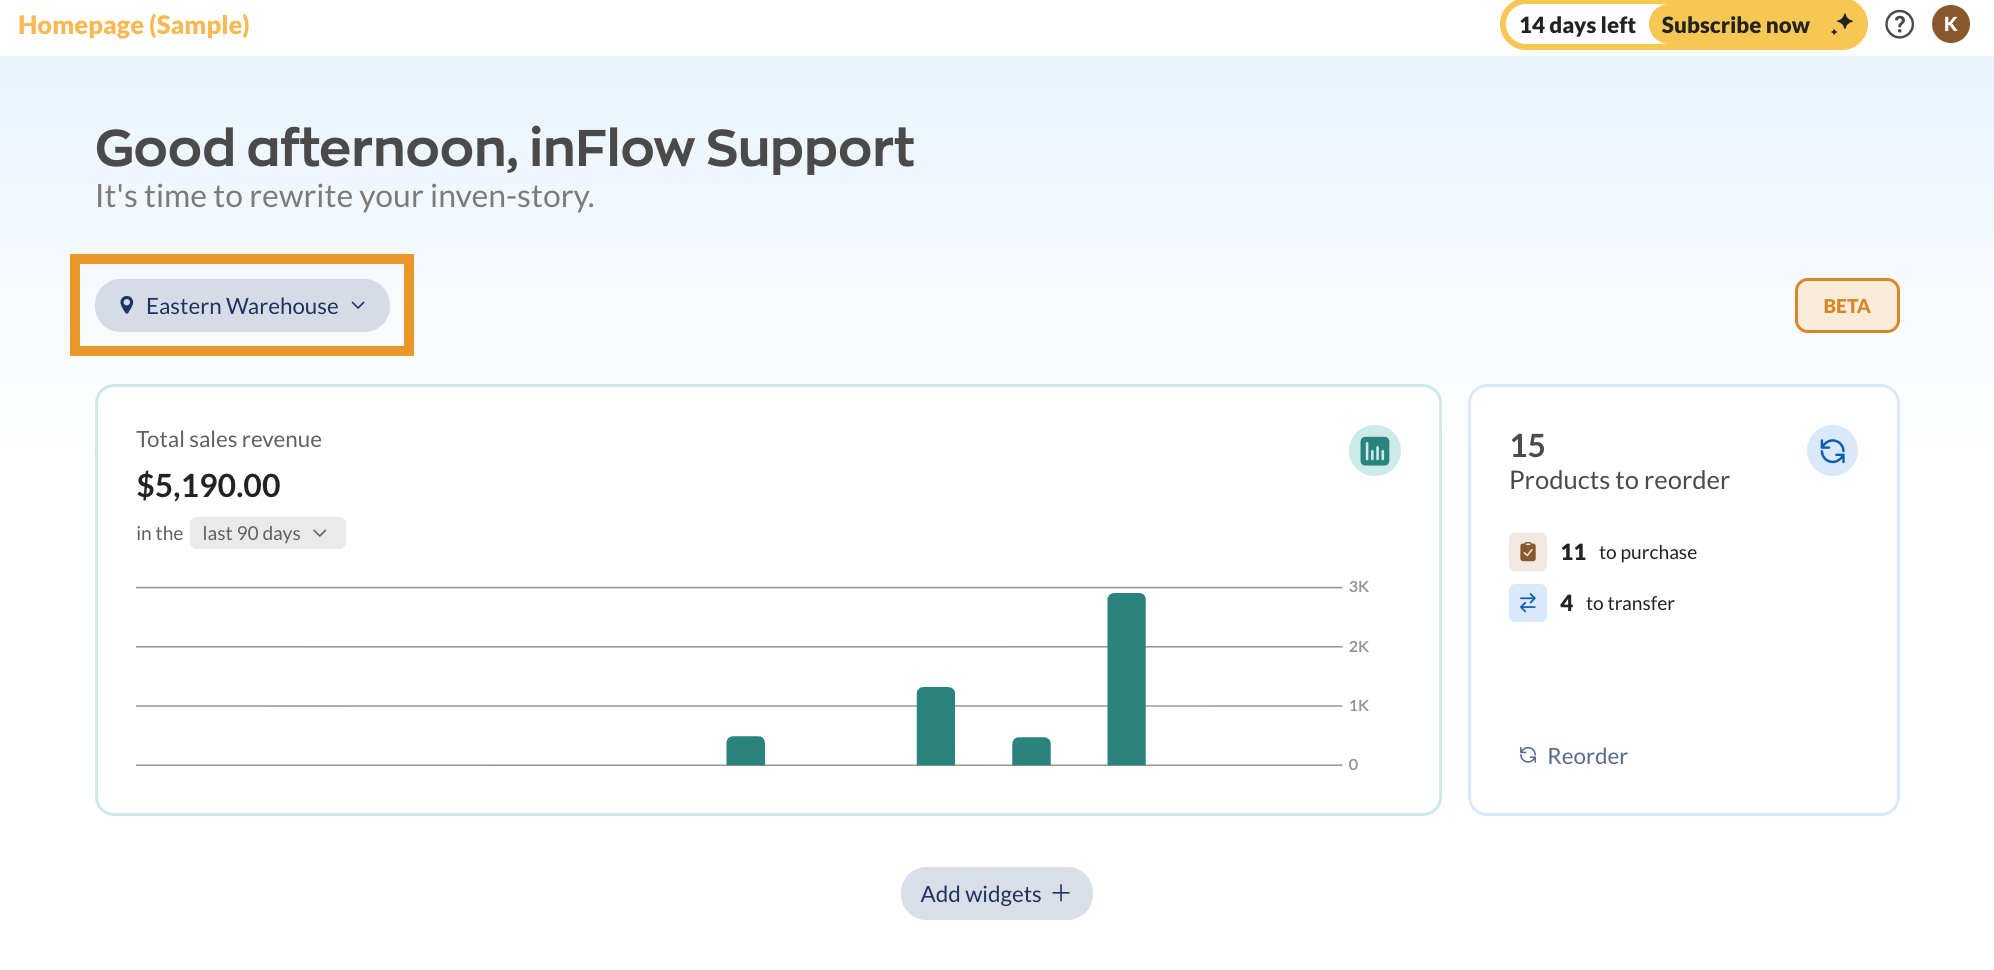
Some widgets display data only when a specific location is selected. Other widgets, such as the Total inventory cost value, can only show data when All locations is selected.
- To select All locations, click on the location drop-down menu.
- Click on Clear.
Widget overview
By default, several widgets are pre-loaded on the Dashboard, giving you a glance at sales, customers, purchasing, products, and manufacturing (for accounts subscribed to inFlow Manufacturing).
Click Add widgets at the bottom to add more widgets to the Dashboard.
Editing & customizing widgets
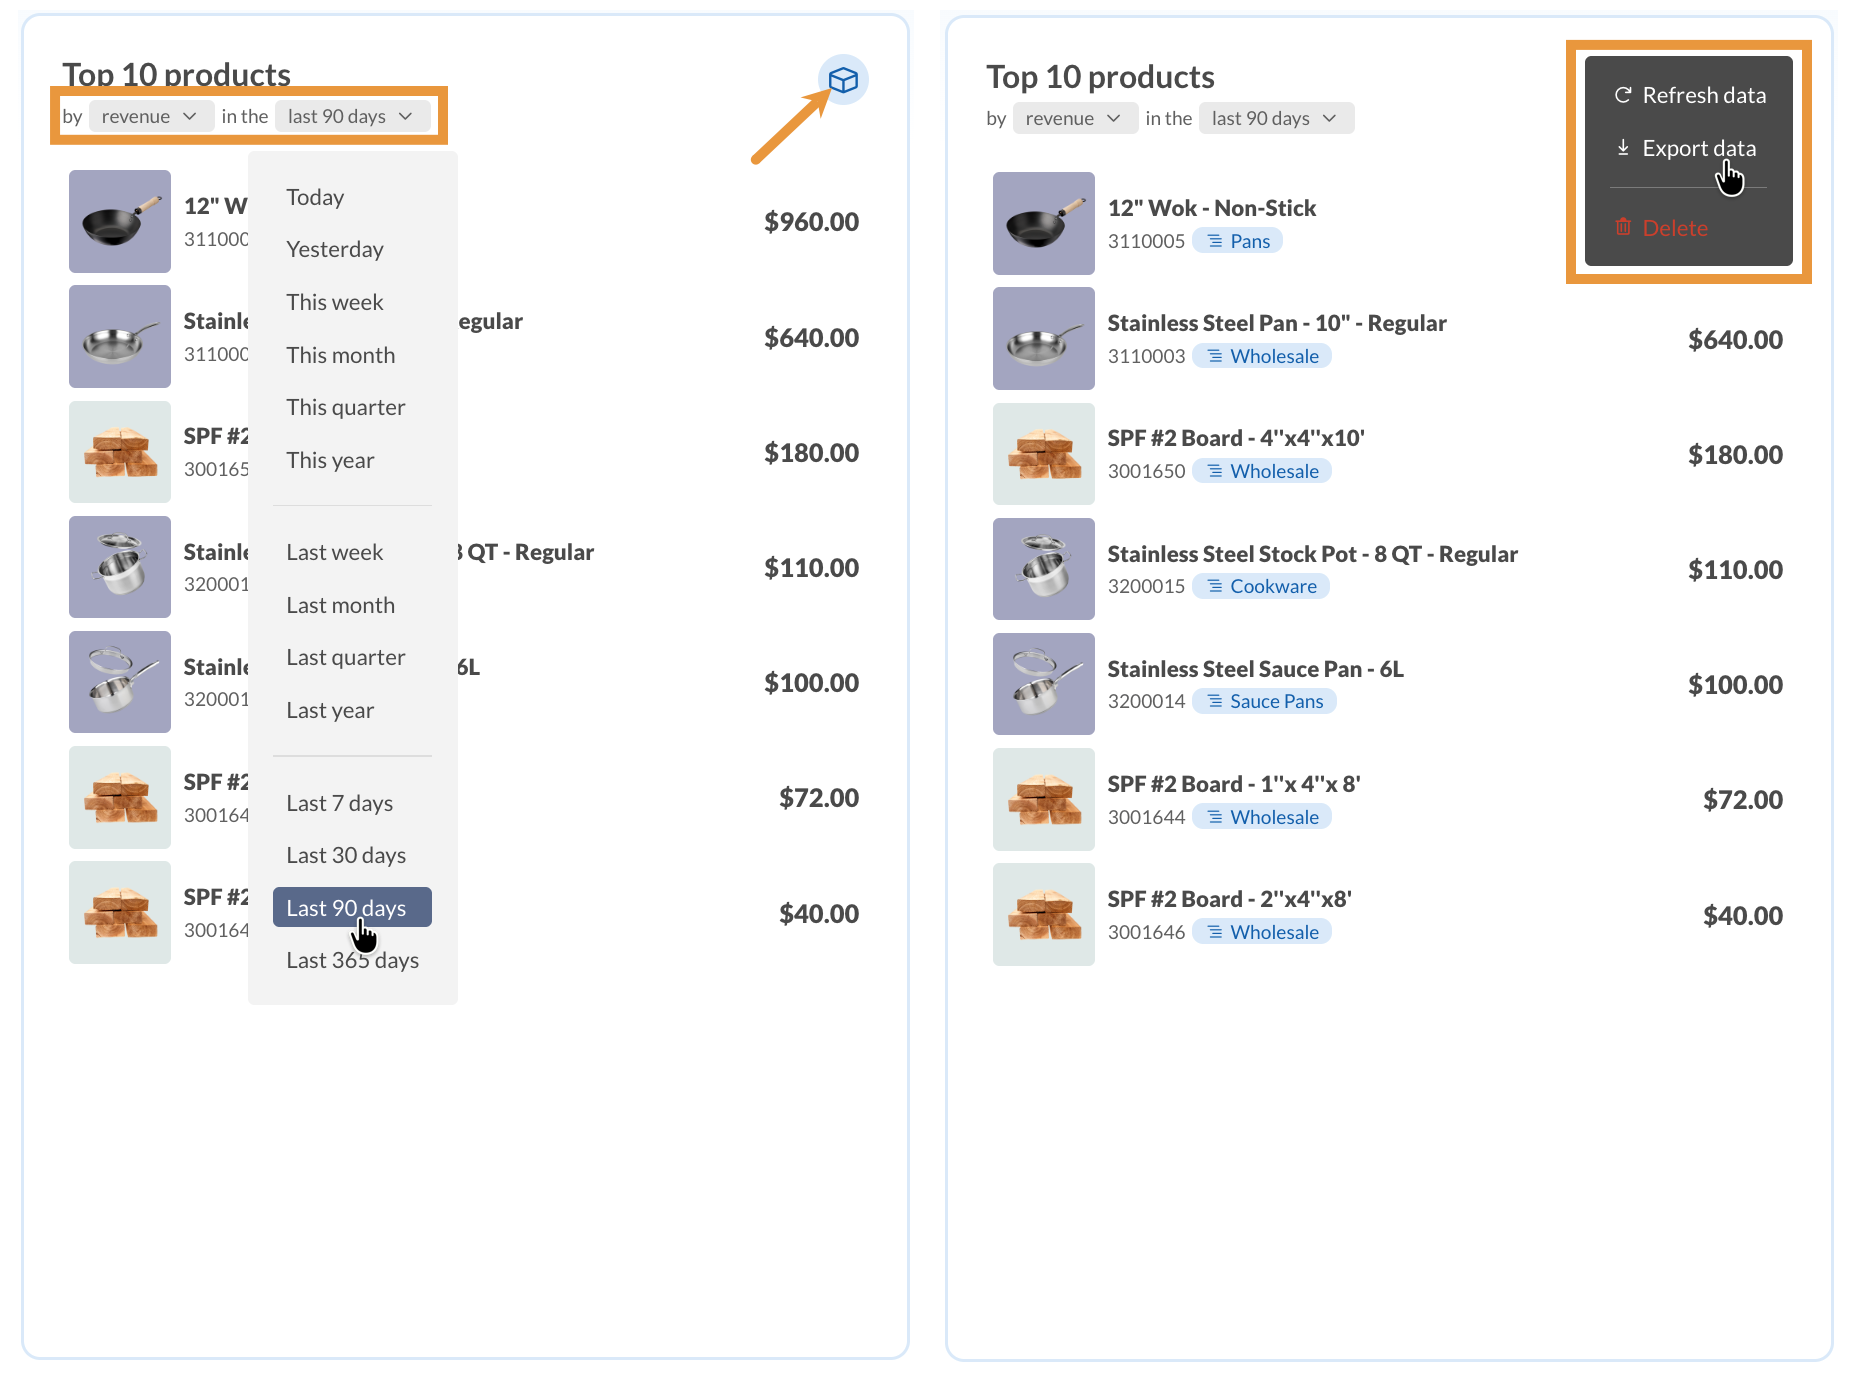
Most widgets have filters to change the data in the widget or options to change the date range.
The icon in the top-right corner opens the widget menu. This button lets you refresh the data, export it to a CSV file, or edit the widget.
You can rearrange the widgets by clicking and holding the grab handles at the top-right corner.
Resizing widgets can show more or less data. Click and hold the bottom right-hand corner of the widgets to resize them.
When you make changes to the dashboard, they’ll be saved and only affect your inFlow profile. This way, every team member can customize their dashboard to highlight the info that matters most to them!
User access rights
The dashboard will hide any widgets that team members can’t access based on their user access rights, so they’ll only see what’s relevant to them. There are restrictions for features, costs, locations, sales reps, and reporting.
Which widgets can I add to the Dashboard?
Sales
- Open sales orders
- Total sales revenue
- Unpaid sales orders
- Top customers
Purchasing
- Open purchase orders
- Unpaid purchase orders
Products
- Top products
- Total inventory cost value
- Products to reorder
Manufacturing
- Open manufacture orders
Other
- Quick create (Shortcut to create something new, e.g., sales order or product)
- Saved report shortcut (view a list of saved reports)
Let us know what you think!
Have an idea for a Dashboard widget you’d like to see? Reach out to the inFlow team and let us know!
Windows
Get to know the inFlow dashboard
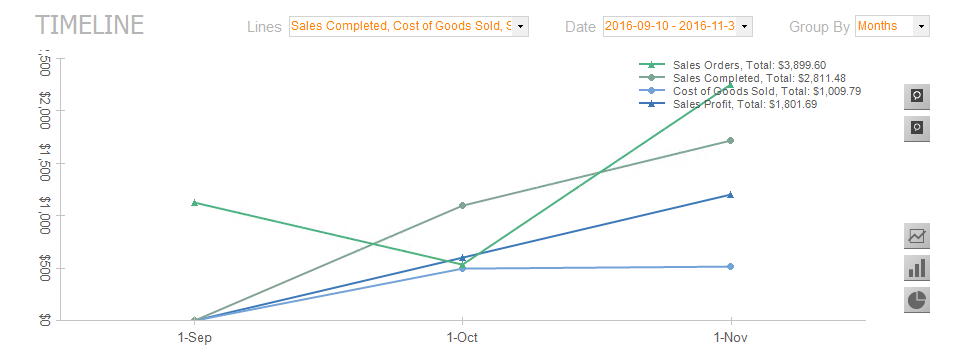
The main graph can provide visual representations of your sales and cost totals, among other metrics.
Using the drop-down selections at the top of the screen, you can choose to show different information, and the graph type can be controlled using the buttons on the right. Items of interest will appear along the bottom of the dashboard so you can quickly see what requires your action.
Outstanding & top 5 lists
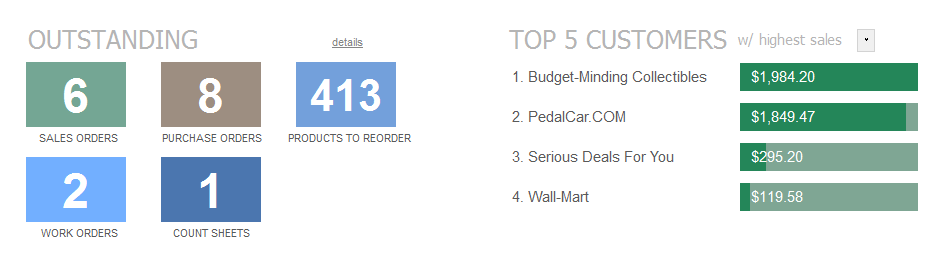
Outstanding sales, purchases, and work orders, as well as products to reorder, can be easily accessed in the bottom-left corner of the screen.
The Top 5 list on the right can show you any number of statistics at a glance, for example, the top five vendors your company purchases from, the top five products that sell the quickest, your most active customers, or (as in the example above) the top five products in stock. You can also change the number (it can be top 10, top 20, etc).


0 Comments