 Fellow Canadians: All inFlow plans are available in Canadian dollars






Key takeaways
- Sell-through rate measures how much inventory you’ve sold compared to how much you received, typically expressed as a percentage.
- The sell-through rate formula is: (Units Sold in a Month ÷ Units at Start of Month) × 100. A higher percentage means inventory is moving efficiently.
- Tracking sell-through helps businesses avoid overstocking or understocking, leading to better cash flow and reduced storage costs.
- Ideal sell-through rates vary by industry and product type, but most retailers aim for at least 70–80%.
- Regularly monitoring sell-through enables data-driven decisions around promotions, reordering, markdowns, and discontinuations.
- Tools like inFlow can automate sell-through tracking, helping businesses make faster, more informed inventory decisions.
If your business carries inventory, you should understand what a sell-through rate (STR) is, how it works, and why it’s essential. Once you grasp the basics, you can improve this key metric for each of your products.
A product’s sell-through will tell you how popular it is, how much you need to order, how frequently you need to reorder, and how much revenue you can anticipate. These insights make sell-through rate one of the most valuable metrics for inventory planning.
Ordering too much of one product and too little of another can cost money and cause serious frustration. However, having a solid grasp on how much inventory to order at the right time will help your business maximize sales, turn profits quickly, and make wise purchase decisions.
What sell-through rate means
Sell-through rate is one of the most important inventory metrics for measuring how efficiently products move through your business. Whether you’re a retailer deciding what to reorder or a manufacturer planning production, your sell-through rate helps you understand which products are performing well and which ones may be tying up cash.
Sell-through rate definition
Sell-through rate (STR), sometimes called your rate of sale, is the percentage of inventory you’ve sold during a specific period compared to the total amount of product you had available at the beginning of that period.
Most businesses calculate sell-through monthly and use the results to make strategic improvements over time. In general, the higher a product’s sell-through rate, the better.
Both retailers and vendors use sell-through rate to make better inventory decisions. Retailers can identify seasonal trends, understand which products are most popular, improve demand forecasting, and determine how much inventory to reorder. Vendors can use sell-through data to estimate how much product they should manufacture and how to price their items.
Why sell-through rate matters for inventory and cash flow
Sell-through rate shows how efficiently your business converts inventory into sales. It’s one of the most widely used inventory management key performance indicators (KPIs) because it helps you determine how much inventory to purchase and how often you should reorder.
The goal is to maximize sell-through across your product catalog as part of a broader inventory optimization strategy. Products with high sell-through rates move quickly, reducing storage costs and minimizing excess inventory. Products with low sell-through rates, on the other hand, create excess inventory that ties up cash, occupies valuable shelf space, and increases carrying costs until they’re sold.
How to calculate sell-through rate
Calculating sell-through rate is straightforward. All you need is the number of units you sold during a given period and the amount of inventory you had on hand at the beginning of that same period. Once you have those numbers, you can calculate your sell-through percentage in just a few steps.
Sell-through rate formula
To calculate sell-through rate, divide the number of units sold during the period by the amount of inventory you had at the start of that period. Then multiply the result by 100 to convert it into a percentage.
The formula looks like this:
Sell-through rate (%) = (Units sold during the period ÷ Units on hand at the beginning of the period) × 100
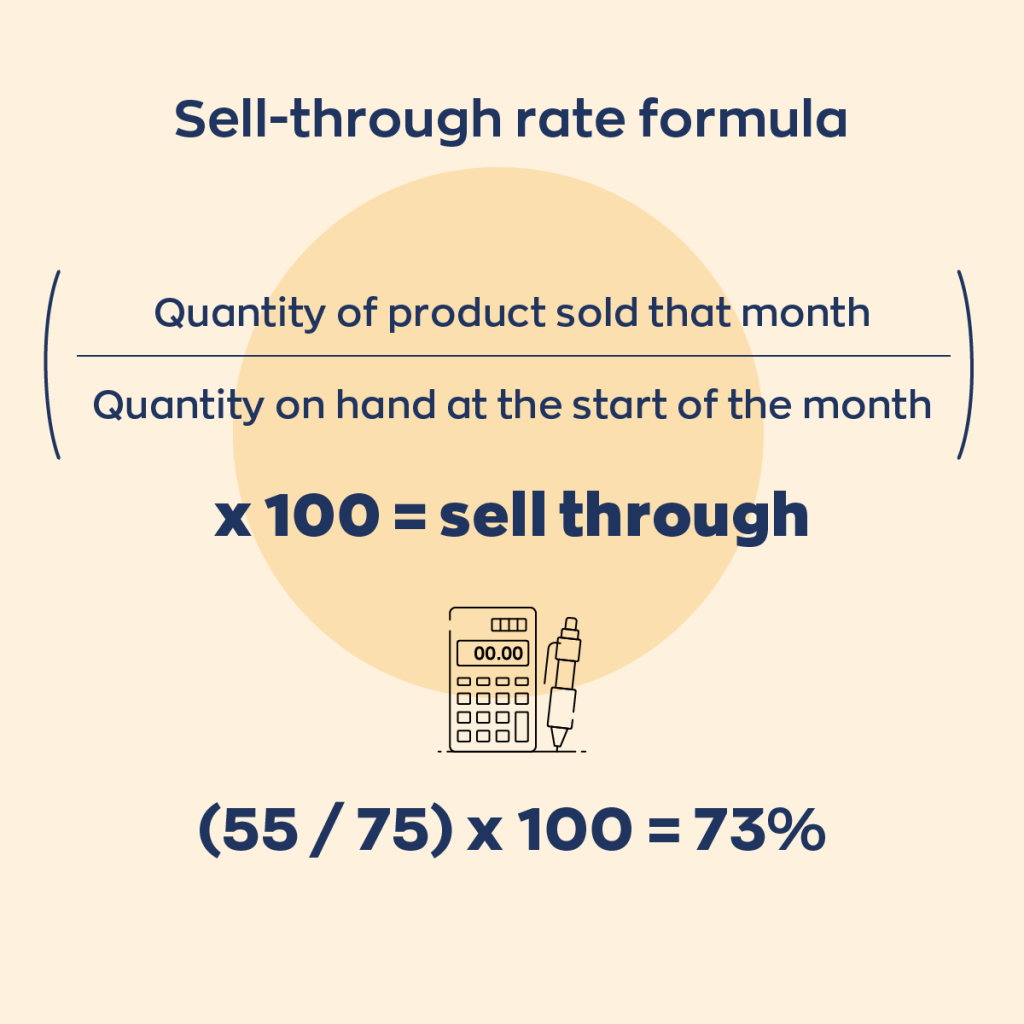
A higher percentage means you sold more of the inventory you started with. Many businesses calculate sell-through monthly, but you can use any time period as long as you’re comparing units sold against your beginning inventory for that same period.
Sell-through rate example
Let’s say you receive 75 candles at the beginning of the month. By the end of the month, you’ve sold 55 of them.
Your calculation would look like this:
(55 ÷ 75) × 100 = 73%
In this example, your sell-through rate is 73%, meaning you sold nearly three-quarters of your starting inventory during the month.
Common calculation mistakes
One of the most common mistakes is using the wrong inventory number in your calculation. Sell-through rate is based on the inventory you had at the beginning of the period, not your current inventory level or the amount you received later in the month.
It’s also important to compare the same time period for both numbers. For example, if you’re calculating monthly sell-through, use the units sold during that month and the inventory you had at the beginning of that same month. Using mismatched time periods will produce misleading results.
If you don’t want to calculate it manually, you can also use an online sell-through rate calculator to quickly verify your numbers.
What a good sell-through rate looks like
There’s no single sell-through rate that’s considered “good” for every business. The right benchmark depends on your industry, product mix, sales channels, seasonality, and business goals. Rather than comparing yourself to other companies, focus on establishing benchmarks that make sense for your own products and tracking how they change over time.
Benchmark ranges by product, season, and channel
A good sell-through rate varies by product, season, platform, and your overall inventory strategy. A healthy STR for your business may not be considered strong for another company, and vice versa.
As a general guideline, a sell-through rate of 80% or higher is considered excellent, while anything below 40% may indicate a problem.
Use these benchmarks as a starting point, not a hard rule. If an item’s sell-through rate consistently exceeds 85%, you may be understocking or pricing it too low, which suggests considering larger purchase orders or higher prices. On the other hand, if sell-through regularly falls below 30% to 40%, you may need to lower the price, run a promotion, or reduce future orders for that product.
How store location and sales channel affect sell-through
If you manage inventory across multiple locations, comparing sell-through rates can reveal important differences in customer demand. Even if each store receives the same amount of inventory, some products may sell much faster in one location than another. These insights can help you adjust future inventory allocations and reduce overstocks.
Sales channels matter just as much. Some products perform better online, while others sell more effectively when customers can see, touch, or try them in person.
Even among ecommerce platforms, customer behavior can vary. Etsy shoppers often look for handmade or unique products, while eBay buyers tend to be more price-conscious and focused on finding deals. Testing multiple sales channels can help you identify where your products generate the highest return on investment (ROI).
Sell-through rate compared with related metrics
Sell-through rate is often discussed alongside other inventory and retail metrics. While these terms are related, they measure different parts of the inventory lifecycle and can provide different insights for manufacturers, wholesalers, and retailers.
Sell-through rate vs. sell-in
Sell-through rate measures how much inventory has been sold during a specific period compared to the amount you had available at the beginning of that period.
Sell-in refers to the sale of products from a manufacturer or supplier to a retailer or distributor. Because it measures wholesale demand rather than consumer demand, sell-in data helps manufacturers understand what retailers are buying and forecast future production more accurately.
Sell-through rate vs. sell-out
Sell-out measures the final stage of the sales journey: the sale of products from a retailer to the end customer.
While sell-through rate measures the percentage of inventory sold over a given period, sell-out focuses on consumer purchases. Tracking sell-out data helps retailers better understand customer preferences, buying behavior, and product performance.
Sell-through rate vs. inventory turnover
Sell-through rate and inventory turnover ratio are both used to measure inventory performance, but they answer different questions. Together, they provide a more complete picture of inventory velocity and how efficiently products move through your business.
Sell-through rate focuses on the percentage of inventory sold during a specific period, while inventory turnover ratio measures how quickly inventory is replenished over time.
Knowing your inventory turnover by product can help you order the right quantities at the right time of year. For example, toys may have a much higher turnover rate during the holiday season than they do in the spring. As inventory turns over more quickly, you may need to carry additional stock to keep up with demand.
How to improve a low sell-through rate
A low sell-through rate doesn’t always mean a product is a failure. It could be priced incorrectly, marketed poorly, stocked at the wrong time of year, or simply overstocked. Before making changes, identify why the product isn’t selling. Once you understand the cause, you can choose the right strategy to improve sales or reduce excess inventory.
Diagnose why sell-through is low
Before taking action, ask yourself a few questions:
- Is the product priced too high?
- Did you order too much inventory?
- Does it need better marketing or promotion?
- Is it competing with a more popular alternative?
- Is it a seasonal product that’s simply out of season?
Seasonality can have a significant impact on sell-through. For example, a wool blanket might have an 85% sell-through rate in December but sell much more slowly during the summer. Likewise, a picnic tablecloth could perform well in the spring but struggle to sell in October.
Once you’ve identified the root cause, you can adjust your inventory strategy accordingly.
Check pricing and discount strategy
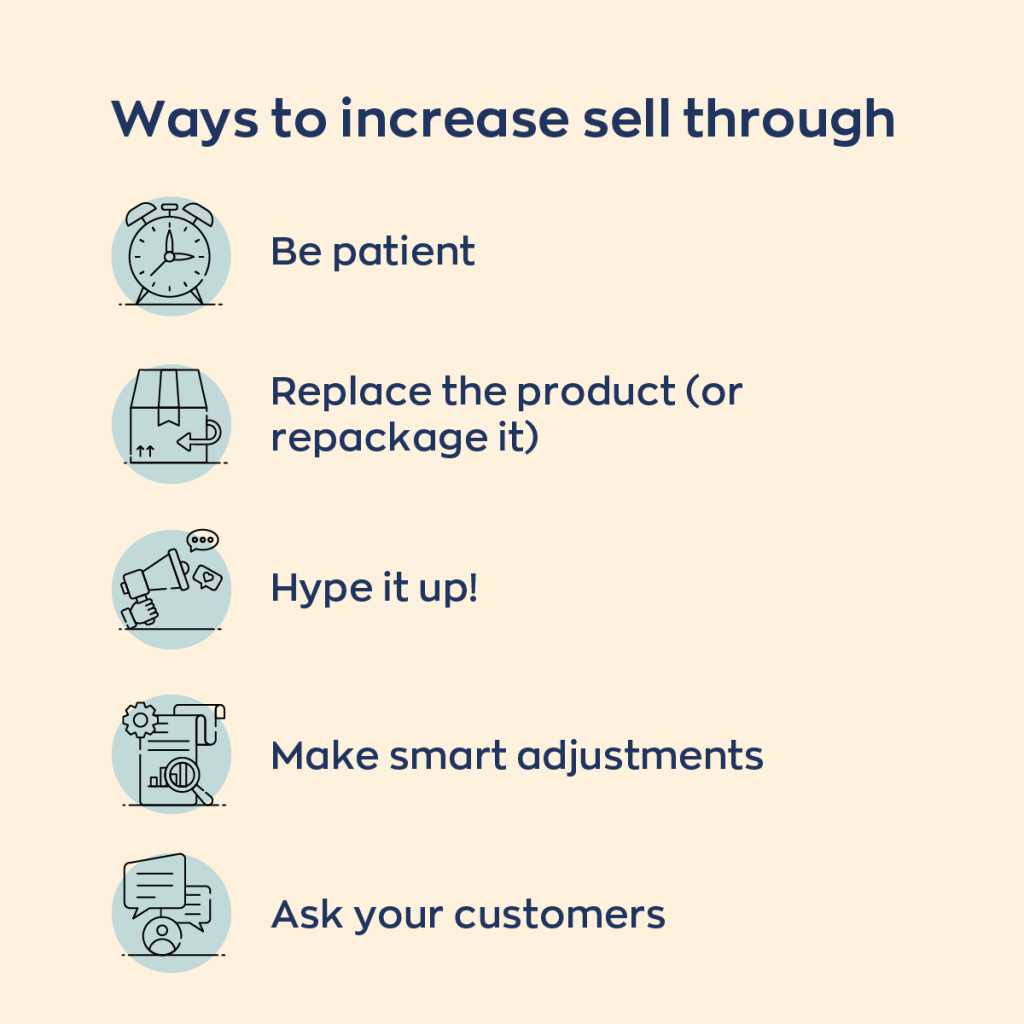
Pricing strategy is often one of the biggest factors affecting sell-through. If customers see value but hesitate to buy, a price adjustment or limited-time promotion may be enough to increase demand.
You can also use discounts strategically to clear aging inventory before it ties up even more shelf space and working capital.
Review packaging, bundling, and product presentation
Sometimes the product isn’t the problem. It’s how it’s presented.
If a new product isn’t gaining traction after a month or two, consider repackaging it or bundling it with a related item. Promoting it through email, social media, or advertising can also increase visibility and generate interest.
For physical stores, don’t overlook the shopping experience. A clean, organized store and effective product displays can have a meaningful impact on sales. The same principle applies online, where clear product photos and descriptions help customers buy with confidence.
Adjust assortment, seasonality, and reorder quantities
If a product consistently underperforms, it may be time to replace it with a better-selling alternative or reduce future purchase quantities.
You should also consider whether:
- the product performs better during a different season
- another size, color, or variation would sell more effectively
- customers prefer a different brand
- ordering smaller quantities would reduce excess inventory
- the item could be offered as an add-on or bundled with a more popular product
Not every product deserves permanent shelf space. Products that consistently underperform can eventually become dead stock, making it worthwhile to discontinue them and free up space for inventory that better matches customer demand.
Ask customers what isn’t working
If you’re unsure why a product isn’t selling, ask your customers directly.
A simple email survey or post-purchase questionnaire can help you understand whether the product is overpriced, out of style, out of season, or simply not something customers want. Their feedback can help you decide whether to adjust pricing, improve the product, or replace it altogether.
Choose the right action for each SKU
Different products require different solutions. Reviewing SKU performance individually helps you decide whether a product should be reordered, discounted, or discontinued. A newly launched SKU may simply need more time and better promotion, while an aging product with consistently low sell-through may need a price reduction, seasonal adjustment, or replacement.
Rather than treating every slow-moving product the same, use sell-through rate alongside customer feedback, seasonality, and sales trends to decide the best course of action for each SKU. Doing so will help you reduce stagnant inventory, improve cash flow, and make better purchasing decisions in the future.

How to track sell-through rate in inventory software
Calculating sell-through rate occasionally is useful. Tracking it consistently is even better. Inventory management software automatically records sales, inventory levels, and purchasing activity, making it much easier to monitor product performance and spot trends before they become costly.
Reports and fields to monitor
The best inventory systems track the quantity and cost of every sale, providing the inventory analytics you need to evaluate each product’s performance over time.
When reviewing your inventory, keep an eye on metrics such as:
- units sold
- current stock levels
- inventory value
- sales trends over time
- slow-moving inventory
Together, these reports can help you identify which products deserve additional investment and which ones may require a different strategy.
When to reorder, markdown, or discontinue
Sell-through rate becomes most valuable when it drives stock replenishment, pricing, and assortment planning.
Products with consistently high sell-through rates may need larger purchase orders or more frequent inventory replenishment to avoid stockouts. Products with lower sell-through rates may benefit from a markdown, promotion, or seasonal adjustment. If an item continues to underperform despite these efforts, it may be time to discontinue it and replace it with a stronger seller.
Inventory software like inFlow helps you make these decisions with confidence by tracking inventory movement in real time. Our built-in barcode system also makes it easy to record inventory as it moves through your warehouse, reducing manual data entry and helping ensure the reports you rely on are accurate.
0 Comments